
Start your IntelliJ IDEA (we support version 13 and up, both Ultimate and Community editions) and simply go to File > Settings > Plugins. Choose Browse repositories... and search for WatchDog . Our WatchDog plugin will appear. Click Install plugin and select Yes to install WatchDog. Restart IntelliJ. That's it!
Alternatively, you can download our plugin from JetBrains Plugin Repository and choose Install plugin from disk...
WatchDog silently runs in your IntelliJ. Its only trace: A small icon in the IntelliJ toolbar.
https://plugins.jetbrains.com/plugin/7828
Fire up your Eclipse (we support 3.7, 3.8, 4.2, 4.3, 4.4, and 4.5) and simply drag the install button into your Eclipse 
... or go to Help > Install New Software. Add the WatchDog Update Site URL below behind Work with:. Our Test Roots Development Tools will appear. Tick them and click Next to install WatchDog. Restart Eclipse. That's it.
WatchDog silently runs in your Eclipse. Its only trace: A small icon in the Eclipse toolbar.
http://updatesite.testroots.org/updatesite
WatchDog has been made by people with a passion for software for people with a passion for software. We know how annoying plugins and surveys can be. WatchDog runs silently in the background and you won't notice it's there.*
(* Except if you do, please file a bug report. )
How much do you test? Do you perhaps follow test-driven design, and didn't realise it? How many context-switches do you do per hour? How often do you run your tests? Does your production code co-evolve with your tests? Do you actually use the IDE-provided debugging infrastructure? What actions do you perform during a debugging session? The WatchDog plugin tells you. And only you.
WatchDog's privacy policy has been assessed and approved by the Human Research Ethics Committee of TU Delft.
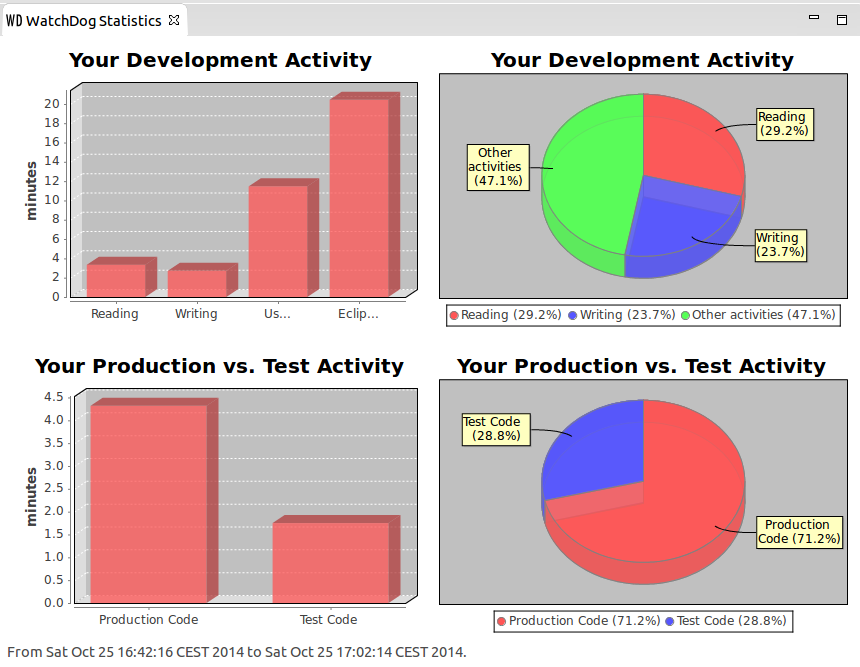
Get instant statistics on your development behavior with our WatchDog Statistics View. In Eclipse the WatchDog View can be plugged into any place and it gives you a basic summary of your accumulated development behavior of the last hour.
To open the WatchDog view, open Window from the Eclipse menu and click Show View > Other. Find the WatchDog Statistics view under the Other category (or, simply type WatchDog).
In IntelliJ it is integrated in the toolbar Tool Buttons (by default the right one) and you can open Statistic View by simply clicking on WatchDog icon.

Additionally, you (and only you!) can access a detailed report of your personal test practices, certified by TU Delft.
You'll receive a beautiful report on your personal development behaviour that helps you improve your coding abilities.
So you are already a perfect software engineer, you say? We'll tell you .
Access your personal WatchDog report.
If you want to, you can share personal details such as the organization you work for (given permission by your employer) and your email address to receive personalized reports. By registering and installing WatchDog, you agree that we store your WatchDog data in a data center of TU Delft, The Netherlands, until further notice. We follow the principles of least information gathering, early anonymization and hashing. Only the WatchDog team has access to your raw data. An explanation of which data we gather precisely (including your IP address) follows below. By using WatchDog, you grant us the right that we can perform scientific research on your data, leading to written research papers that might include aggregated user data and graphs, and to release fully anonymized (that is, with no personally linked identifier such as user id, email, or IP address) versions of the submitted WatchDog data. By default, you grant us the right to store your data infinitely until revocation. To have your data removed, please simply contact us, supplying your user id.
The premise of TestRoots is to gain a deep understanding of how software is tested and debugged in the real world, and then suggest improvements based upon this thorough analysis. With WatchDog, we are interested in how you, as a Java developer, utilize the IDE and Junit. Not what you use it for. Hence, the data WatchDog measures is strictly numerical: We never transfer any content (not file names, and not even project names). You can trust us on this, we are nice people. Or read on, and discover what little data WatchDog, the unobtrusive, open-sourced Eclipse and IntelliJ plugins developed at TU Delft, really transfer.
If transfering things over the internet is a problem for you or your company, we have a super-easy to setup virtual machine image. You can install this locally or on a server in your company. Please contact us in that case.
WatchDog centers around the concepts of intervals and events. Based on what event WatchDog receives from the IDE, it closes or creates a new interval or debug event. We have intervals for when you start your IDE, when you change focus to it, when you change your perspective, when you run Junit tests, when you launch the debugger and when you read or type code. When you read or type code, we see if we can figure out whether that's production or test code. When you type, we try to figure out how much code you changed in each typing interval (by calculating the Levensthein distance). That's all we do. So we will never see one letter that you type.
In addition, we have events for when you add, change or remove a breakpoint, when the program you are debugging is suspended or resumed, when you inspect or modify a variable value, when you perform a step into, over or out action and when you define a watch or evaluate an expression. The same holds for events as for intervals: we never see a letter you type.
Still not convinced? Alright, here's a JSON-ified TypingInterval (the most interesting one, really) as we transfer it to our server:
{ "endingDocument" : { "sloc" : 3, "dt" : "un" }, "diff" : 425, "doc" : { "sloc" : 31, "dt" : "un" }, "it" : "ty", "ts" : NumberLong("1408110488025"), "te" : NumberLong("1408110508039"), "ss" : NumberLong("-7490789694621659010"), "uid" : "935d7573c056c424f668d935ef18b4a0bf96c365", "pid" : "efdcb880844893f847d70907174315d95c50caa6" }
Events are transfered to the server in a similar fashion, as the following JSON-ified StepIntoEvent shows:
{"et" : "si", "ts" : 1460558102310, "ss" : "ZTEmoNvaBEiAsSHeinoHuzELVXbYNMaApKKkOecX", "wdv" : "1.7.0", "ide" : "ij"}